
There are three broad techniques for creating and presenting effective PowerPoint presentations: thesis paper, reference manual, and film. Each category has its advantages, but thesis paper is by far the most common. I wager the majority of presentations given use this format, even if they don’t realize it.
A thesis paper is simply a way of presenting an argument (or thesis) supported by evidence. You apply this concept to PowerPoint by creating a deck that states your argument upfront. In subsequent slides, you support that argument with evidence.
Along the way, visual cues and good organization gently remind the audience how each piece of evidence ties back to your core argument.
By following these guidelines, you will gain the tools to create an effective PowerPoint presentation deck that guides the audience towards what’s important without leaving them lost and confused. From setting a goal to deciding on the color scheme, everything in your deck will combine to lead viewers towards a memorable conclusion.

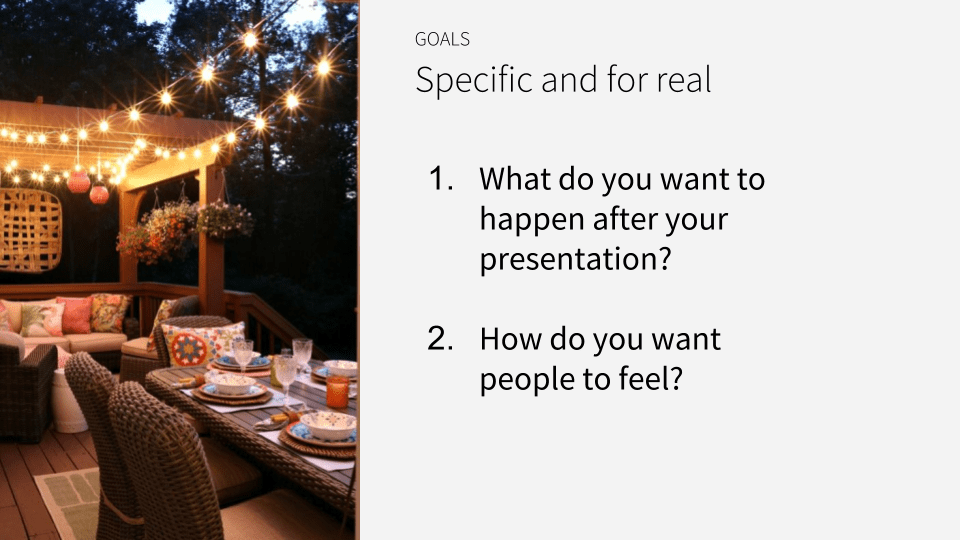
What do you want people to do after your presentation?
Effective PowerPoint presentations start with clear goals.
Your goal must be more specific than “sharing information.” The goal of every presentation is sharing information. That’s nothing special. What is special is what you want people to do after you share that information. What action should they take?
Once you answer this simple question, the rest of your presentation will come into focus.
Maybe you want people to learn something new so they can perform their jobs better. Maybe you want them to change something about their behavior. Or maybe you want them to believe you have everything under control. You need no help. You want no input. You got this.
These are all valid goals. Push yourself to be very specific about the goal you set for your own presentation. And if you don’t want them to learn or do anything differently, well, ask yourself why you’re giving this presentation in the first place.
Stuck on your goal? Ask yourself, “How do I want people to feel after my presentation?” Feelings are often overlooked. I’ve given presentations where I wanted people to feel upset or awkward. Sometimes you need to deliver bad news, and in order for that news to land you need to get a little uncomfortable. Knowing how you want people to feel will point you towards your goal.
Read more: Using neuroscience to create an effective presentation
Turn your goal into a dot-dash before you make slides
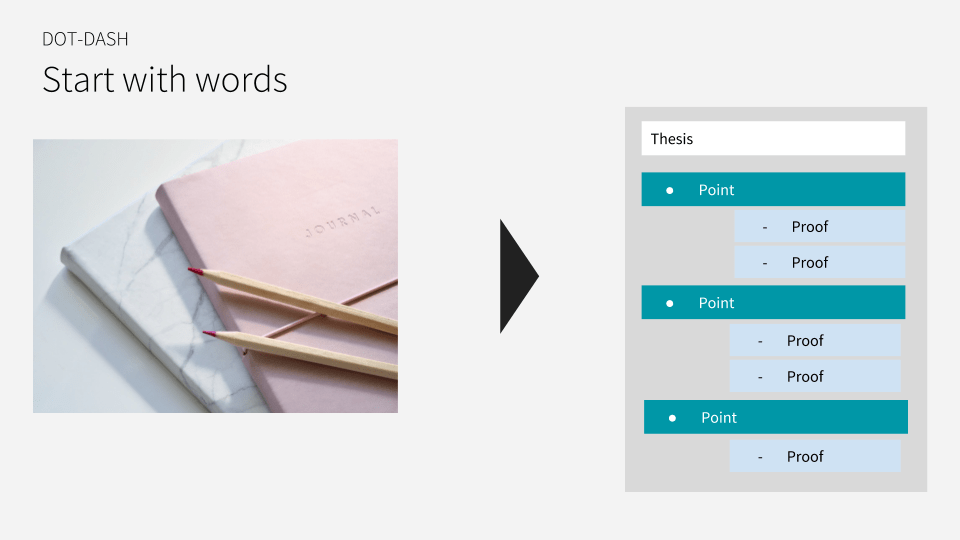
Now you have a goal, but how will you achieve that goal? Start by organizing your thoughts into a dot-dash outline. It’s easy to create, quick to scan, and shows how everything you will present ties back to your overall goal.
Start your dot-dash with a thesis statement. Your thesis should capture how this presentation will accomplish your goal. Next, outline key points or topics that support your thesis. Finally, connect those points or topics with supporting evidence.
That’s a little abstract, so here’s an example: When I created the presentation deck you see in this post, my goal was for the audience to create and deliver effective PowerPoint presentations themselves. That’s what I wanted them to do after seeing my presentation.
My thesis – or the way my presentation accomplishes this goal – is to explain some best practices for creating and presenting PowerPoint presentations. Key points include defining a goal, creating a dot-dash, and basically everything else you’re reading here. Every point ties back to the thesis which ties back to the goal. It’s all connected.
Word of warning: Don’t skip the dot-dash and go straight to making slides. You will be tempted to do this; I know I am every single time. But creating the dot-dash first saves you time and sanity by forcing you to map out your presentation and determine how each part ties back to the goal. If you start on slides right away, it’s too easy to get lost in the details of slide-making. You lose sight of your overall goal, and end up creating beautiful slides without a purpose.
Organize your slides based on the dot-dash outline
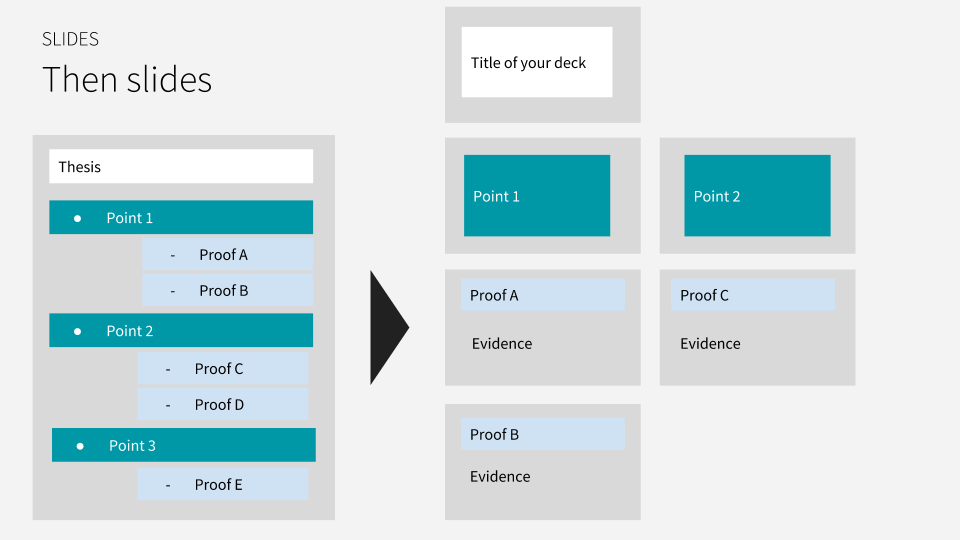
Now it’s time to turn your dot-dash outline into actual slides. Look at the image below. On the left is your dot-dash. Maybe you sketched it out on a piece of paper. On the right are the first six slides of your presentation. Do you see how each of those slides matches a part of your dot-dash?
Your thesis in the dot-dash is incorporated into the title of your deck. The key points become titles as well that introduce the different topics of your presentation. And the bullet points you created to support each key point becomes its own slide support by evidence.
This is structured, efficient deck-building. Your presentation is more memorable when the audience is able to follow your reasoning and understands how all the information relates back to a single goal.
Word of advice: Chances are, as you map out your dot-dash and starting creating slides, something will change. Maybe a new piece of evidence reveals itself, or you decide to cut one of the key points. Whatever the case may be, be ready for the unexpected. This is why I recommend not going straight into slide creation. These sorts of changes are easier to make when you’re working with outlines rather than finished slides.
Treat each slide as a picture
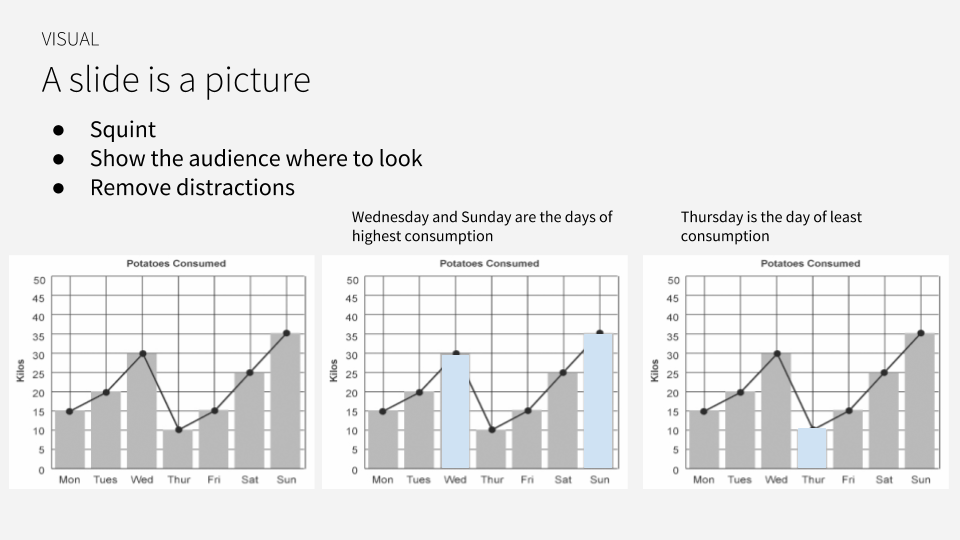
Now it’s time for the slides. When creating slides, there’s one key piece of information you have to keep in mind: a slide is a picture. You get to decide what you want people to focus on. Even if you have a ton of words on the slide.
See for yourself. Try looking at one of your slides and squinting your eyes just a bit to blur it out. Where does your eye naturally fall? If that spot is not where you want people to pay attention – whether it’s a picture or text or part of a graph – then change something about the design of that slide to make your eye fall where you want. Remove any other distractions from that point.
In the image below you see three graphs. Each graph shows the same data, but in slightly different ways. The one on the left gives the viewer no direction, so we don’t know what is important. The other two have a header and one or two bars that are a different color. This change guides the eye towards what is important about this graph.
If you blur your eyes and look at one of those graphs, chances are your eye will fall on the blue section.
Want to dive deeper? In another post, I cover how to present data in a presentation. It covers these rules and good deal more. But if you just want the punchline: Know that you have an obligation to never misrepresent data. You can guide the audience towards one point or another, but those points must be factually sound. Never manipulate the presentation to warp the meaning of the facts.
Read more: 8 interactive presentation games for large teams
Add trackers to help the audience follow along
At this point, you should have a solid presentation on your hands. Good slides. Logical layout. Clear goal. There’s just one final touch your deck needs to tie it all together: trackers.
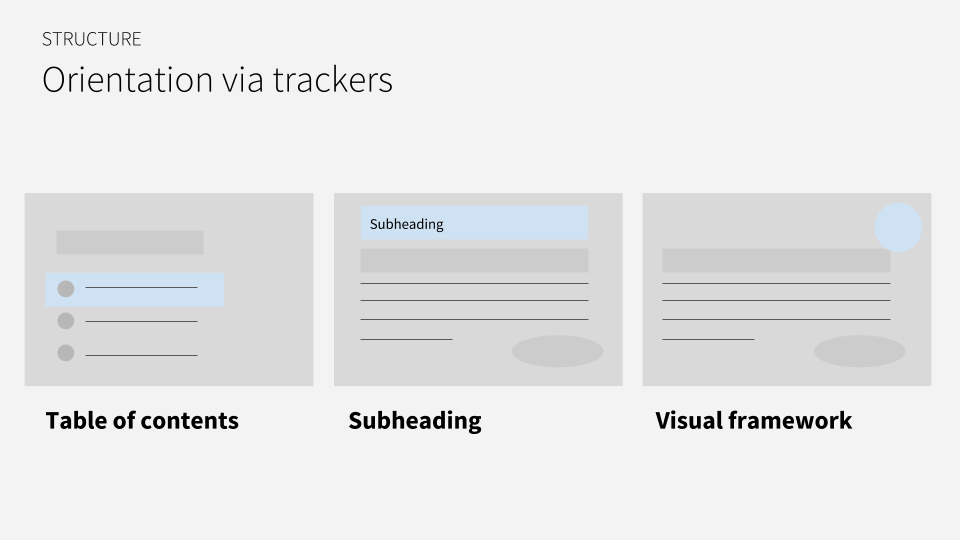
Trackers are a visual cue that lets the viewer know where they are in your presentation. I’ve outlined three types of trackers in the image below, but they all accomplish the same thing: helping the audience orient themselves within your presentation.
Orientation is important for lots of reasons. Let’s say you’re listening to a speaker and suddenly get a message on your phone. You look down at the phone, fire off a reply, look up again, and… what’s all this? The presenter is on a different slide. Is this part of the previous discussion or something new? Trackers let you answer these questions and more quickly so you can refocus on what’s important without feeling lost.
As you can see in the images in this post, I used a combination of Table of Contents and Subheader trackers in my presentation. The table of contents lays out what is going to be presented, and then each subheader relates that slide back to the table of contents. That way there’s no confusion about which slides go with which topics.
Guide the audience through each slide as you present
If you followed each step of this guide – goal, dot-dash, structure, and all – then you poured a lot of effort into your presentation deck. That means most of the heavy lifting for the presentation is already done. You know the slides inside and out. Talking about them should feel easier as a result.
There are five steps to presenting almost any PowerPoint slide. These steps mirror the steps we’ve followed here in this guide. You state the thesis, explain the key point(s), and move to the next slide in a logical way. Think of yourself as a PowerPoint tour guide. Your job is to lead people through each slide, pausing to point out notable information before ushering everyone along to the next slide.
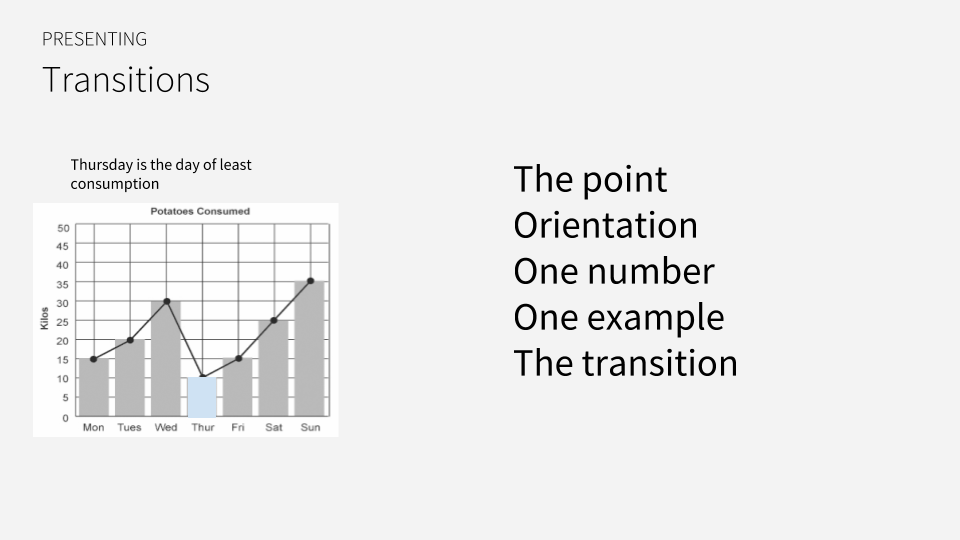
Here are the five points you need to address in each slide:
- The point: Why are you showing people this slide?
- Orientation: What information is contained in this slide?
- One number: What is the key takeaway from this slide?
- One example: How did you arrive at this takeaway?
- The transition: What’s on the next slide?
See how this flow deliberately sets up everything the audience needs to know before announcing the key takeaway? Without the setup, your key takeaway will fall flat – like a bad joke. The audience won’t know what to think until they have finished orienting themselves to each slide.
Read more: 10 instructor-led training activities for before, during, after training
Go forth and give effective PowerPoint presentations
At the end of the day, effective PowerPoint presentations are deliberate PowerPoint presentations. You have your goal: the thing you want the audience to do after seeing your presentation. You know how your presentation will accomplish that goal. You know how each slide ties back to that overall goal. And you know how to deliver each slide with maximum impact. You got this.